> For the complete documentation index, see [llms.txt](https://docs.rootcause.ai/llms.txt). Markdown versions of documentation pages are available by appending `.md` to page URLs; this page is available as [Markdown](https://docs.rootcause.ai/more-details/digital-twin/simulation-types/root-cause-analysis.md).

# Root Cause Analysis

Root Cause Analysis answers a specific question: *this value came out wrong — why?* You point it at a variable that behaved unexpectedly, give it the record you want to diagnose, and it traces **upstream** through the [Digital Twin](/more-details/digital-twin.md)'s causal graph to find what drove the anomaly.

For the workflow that produces a Digital Twin in the first place, see [Step 5: Build Digital Twin](/user-guide/creating-digital-twin.md).

***

## How it works: expected vs. observed

A trained Digital Twin doesn't only predict an outcome from inputs — it learns the expected relationships among *all* the variables. So for any record, it can say, for each value: *given everything else I know about this record, here is the value I'd expect, and the range it should fall in.*

A **deviation** is the gap between the value you observed and the value the model expected. RootCause measures it as a **z-score** — the number of standard deviations the observation sits from expectation:

* A z-score near **0** means the value is in line with what the model expected.
* A **large** z-score (positive or negative) means the value is genuinely surprising — it doesn't fit what the model learned.

Root Cause Analysis starts from the variable you flag as anomalous and walks the causal graph upstream, scoring the deviation of each variable along the way. The upstream variables with the largest deviations are the candidate root causes: they are the surprises that explain the surprise you started with.

> **Root Cause Analysis vs. Anomaly Scan.** They answer opposite questions. **Anomaly Scan & Diagnosis** watches your data and surfaces anomalies *for* you — you don't have to know what's wrong. **Root Cause Analysis** is deliberate: you already know something is off, name it, and ask the platform to diagnose the cause.

***

## Starting a simulation

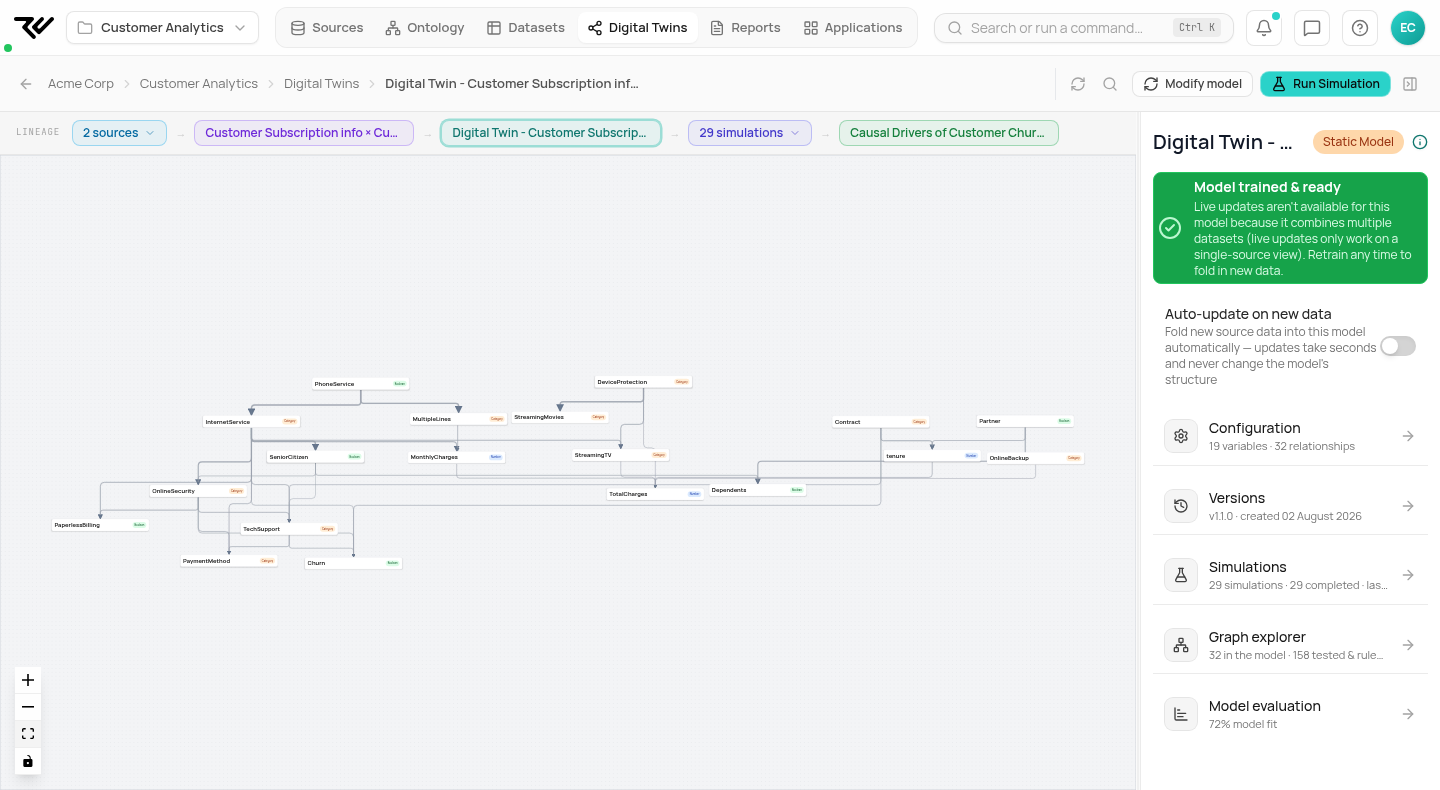
Open your trained Digital Twin from the Digital Twins list.

<figure><img src="/files/lWmrXR4b3B8sbRtL0AXH" alt="A trained Digital Twin&#x27;s Home showing the causal graph, a Model trained and ready banner, and side cards reporting 19 variables, 31 relationships, and a 69.6% model fit"><figcaption><p>Root Cause Analysis runs against a trained Digital Twin — the same causal model that powers every other simulation type.</p></figcaption></figure>

Open the **Simulations** tab, click **New Simulation**, and choose **Root Cause Analysis** from the type picker.

<figure><img src="/files/IcWpqsKu28TR33c4yN2i" alt="The empty Root Cause Analysis setup form: Step 1 Anomalous variable with the Select variable to diagnose dropdown unset, and Step 2 Observed data with one blank record on the Field Input tab"><figcaption><p>The Root Cause Analysis setup as it opens: the anomalous variable to diagnose on top, the observed data to diagnose it against below.</p></figcaption></figure>

***

## Step 1: Choose the anomalous variable

Select the variable showing unexpected behavior. This is the starting point — the analysis traces upstream from here through the causal graph to find likely root causes.

In the example below, the anomalous variable is **MonthlyCharges**: we want to understand why customers' observed charges sit where they do relative to what the model expects.

***

## Step 2: Provide the observed data

Supply the record you want to diagnose. Each row is one independent sample; you can diagnose several at once. As with Prediction, you can enter records by hand (**Field Input**), upload a **File**, or pull rows from a **Data View**.

Each record carries the full customer profile — services, contract, tenure, and the observed MonthlyCharges value. The platform validates required fields before it will run.

<figure><img src="/files/gNlfT1lLMimorItbvf83" alt="The Root Cause Analysis setup form with MonthlyCharges as the anomalous variable and an Input Records table of customer records, one column per record, filled in on the Field Input tab"><figcaption><p>The setup filled in: MonthlyCharges as the anomalous variable, with the observed customer records to diagnose — one column per record.</p></figcaption></figure>

***

## Step 3: Detection settings *(optional)*

These tune how sensitive the analysis is — how large a deviation has to be before a variable is flagged.

* **Target false-positive rate** — the slider runs from 0.1% (strict) to 5% (loose). A lower rate flags fewer variables and reduces false positives; a higher rate flags more. The default is 0.50%.

Leave the default unless you have a reason to change it. Pick the twin version to run on, review the **Configuration Summary**, and click **Run Simulation**.

***

## Running the analysis

The twin runs the diagnosis — scoring the observed records against its learned expectations and tracing the causal path upstream from the anomalous variable. Even a large batch is fast: the run below scored 4,998 records in seconds.

<figure><img src="/files/zkfLq9qpfxAFP2xNrV6b" alt="The Root Cause Analysis run page just after completion: the per-sample deviation table is populated while the AI summary is still generating, with the run configuration — diagnosing root causes of anomaly in MonthlyCharges across 4,998 input samples — in the sidebar"><figcaption><p>The run page as the analysis lands: the per-sample table is already in while the AI summary still generates. The sidebar restates the run — diagnosing MonthlyCharges across 4,998 samples at a 0.50% target FPR.</p></figcaption></figure>

***

## Reading the result

The result opens with an **AI Summary** — a plain-language verdict on the variable you flagged — followed by the **Root Cause Analysis** table: one row per sample, each carrying the target's observed value, the expected value and its range, a severity z-score, whether the sample counts as anomalous, and (when one is found) the top root cause with its confidence.

<figure><img src="/files/aZ64peuv5YiMp1XCuWsg" alt="A completed Root Cause Analysis: the AI Summary reports no identified upstream root cause for MonthlyCharges, with z-scores ranging from −1.27 to 0.20, fully explained by observable factors with observable attribution 1.0 and latent attribution 0.0, above the per-sample table where every row shows a mild z-score near 1.9 against an expected 65.02 ± 27.75 and Anomalous: No"><figcaption><p>A completed analysis. The AI Summary is the headline verdict; the table below shows the working: observed vs expected, severity, and the anomalous flag for every sample.</p></figcaption></figure>

In this run, the verdict was that there was **no clear cause to find**:

> All five samples show no identified upstream root cause for MonthlyCharges, with targetZScore values ranging from **−1.27 to 0.20**, so the anomaly is mild rather than strongly abnormal. The results are fully explained by observable factors, with observableAttribution at 1.0 and latentAttribution at 0.0, **and no causalPaths were found.**

This is the system working as intended, not failing. Across all 4,998 samples the deviations stayed mild: the largest z-scores sat around 1.9, well inside the expected range of 65.02 ± 27.75, so no sample cleared the 0.50% false-positive threshold and none was flagged anomalous. Rather than manufacture a tidy explanation, the platform reported that the observed charges are consistent with what the model expects, and the Observable/Latent attribution split confirms the small deviations that do exist are carried by measured variables, not hidden ones.

That restraint is the point. A Digital Twin's Root Cause Analysis is grounded in the causal model and the evidence in front of it. When the evidence supports a cause, it names it and shows the deviation that justifies it; when the evidence doesn't, it says so. The answer is always defensible, because it never fakes one.

***

## Other Simulation Types

* [Prediction](/more-details/digital-twin/simulation-types/prediction.md) — the most likely outcome for a specific input.
* [Intervention](/more-details/digital-twin/simulation-types/intervention.md) — change a single variable and observe propagation.
* [Optimization](/more-details/digital-twin/simulation-types/optimization.md) — find the input combination that best meets a goal.
* [Best Action](/more-details/digital-twin/simulation-types/best-action.md) — the minimum change needed to reach a target outcome.
* [Explanation](/more-details/digital-twin/simulation-types/explanation.md) — the drivers and impacts behind an outcome.
* [Anomaly Scan & Diagnosis](/more-details/digital-twin/simulation-types/anomaly-scan.md) — scan every variable for anomalies and diagnose each one.

See [Simulation Types](/more-details/digital-twin/simulation-types.md) for the full picture and [Step 6: Run Simulations](/user-guide/simulations.md) for the general overview.
