> For the complete documentation index, see [llms.txt](https://docs.rootcause.ai/llms.txt). Markdown versions of documentation pages are available by appending `.md` to page URLs; this page is available as [Markdown](https://docs.rootcause.ai/api-and-integrations/sdk-getting-started/sdk-notebook-apps.md).

# Interactive Apps in Notebooks

Many RootCause MCP tools ship with an interactive app: the consoles that render inline when you use RootCause from Claude, ChatGPT, or Copilot. The SDK mounts those same apps under notebook cells. Nothing is re-implemented per widget; whatever the platform can render in a chat client, your notebook can render too, and every control round-trips live through the platform with your session's credentials.

## Install

```bash
pip install "rootcause-sdk[jupyter]"
```

> **The distribution is `rootcause-sdk`, not `rootcause`.** Only the *import* name is `rootcause`; `pip install "rootcause[jupyter]"` reaches an unrelated PyPI project.

That is the whole installation. There is no separate extension, no `jupyter labextension install`, no enable step. The widget front end ships inside the package and renders in JupyterLab, Notebook 7, VS Code notebooks, and Colab.

## Results display as their app

The result objects mount their app on their own: display one — as the last expression of a cell, or through `display()` — and the interactive console appears instead of a static table.

```python
>>> twin.graph                                        # the causal-graph console
>>> result = twin.intervene({"Contract": rc.set("Two year")})
>>> result                                            # the What-If Studio, over this run
>>> twin.explain(effect="Churn")                      # the explanation, as its own app
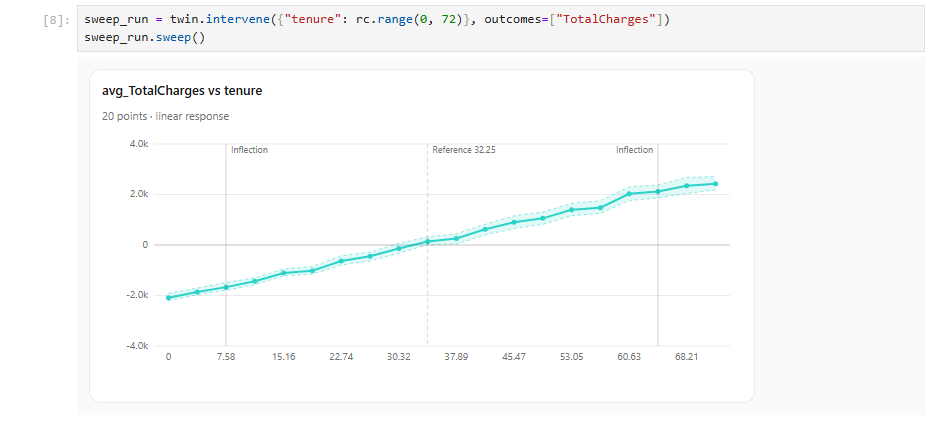
>>> sweep_run.sweep()                                 # the dose-response curve
>>> twin.env("berlin")                                # the environment listing
```

Three rules keep this honest:

* **Displaying never computes.** The app mounts over the result you already have (`result` re-reads the stored run; nothing re-simulates). Assigning to a variable renders nothing, and scripts outside a notebook never enter this path.
* **Displaying never raises.** No `jupyter` extra, an older platform, a fetch that fails — the object falls back to the same static HTML repr it always had.
* **There is a kill switch.** `rc.auto_apps(False)` (or `ROOTCAUSE_AUTO_APPS=0`) turns every display back into the static repr — the right setting for headless notebook executors and exported documents.

Every run result mounts by run id, so the platform decides which app fits the family that ran: `SimulationResult`, `ForecastResult` and `PredictionResult` all reach the same readback, and an intervention arrives as the What-If Studio with the dials and Run exact live on a scenario you ran minutes or months ago, while an explanation or a diagnosis arrives as its own view of that run. `ScoreResult` mounts the scoring register over the digest it already holds. `Graph` mounts the twin console, sweeps mount the curve explorer, and a panel twin's environment subsets mount the environment listing.

<figure><img src="https://1662811113-files.gitbook.io/~/files/v0/b/gitbook-x-prod.appspot.com/o/spaces%2FBXg3gZLR0e2Q8SzeQmql%2Fuploads%2Fgit-blob-2cc25785863d5d97fa29e6ac4ace9f3356ee7771%2Fsdk-auto-display-studio.png?alt=media" alt="A cell reading result = twin.intervene({&#x22;tenure&#x22;: rc.set(60)}, outcomes=[&#x22;TotalCharges&#x22;, &#x22;MonthlyCharges&#x22;]) followed by result on its own line. Under it, the What-if studio renders the completed run: a tenure slider set to 60, KPI cards reading avg_TotalCharges 2.1k to 4.2k (+97.6 percent, statistically significant) and avg_MonthlyCharges no change, a bar chart against the dashed baseline, the narration Setting tenure to 60 moves avg_TotalCharges +2.1k, and the opening scenario pinned below."><figcaption><p>Display the result and the studio mounts over the run you already paid for — no re-simulation, dials live.</p></figcaption></figure>

<figure><img src="https://1662811113-files.gitbook.io/~/files/v0/b/gitbook-x-prod.appspot.com/o/spaces%2FBXg3gZLR0e2Q8SzeQmql%2Fuploads%2Fgit-blob-7080beba335f2198a0ccd497decde2f3f5d8d397%2Fsdk-auto-display-sweep.png?alt=media" alt="A cell running a range intervention on tenure and displaying sweep_run.sweep(). Under it, the dose-response curve avg_TotalCharges vs tenure: 20 points, linear response, confidence band, two inflection markers and the reference value at 32.25."><figcaption><p>A sweep's curve, mounted by displaying the SweepResult.</p></figcaption></figure>

## The twin console

```python
>>> twin = ws.twin("C8 Temporal")
>>> twin.console()
```

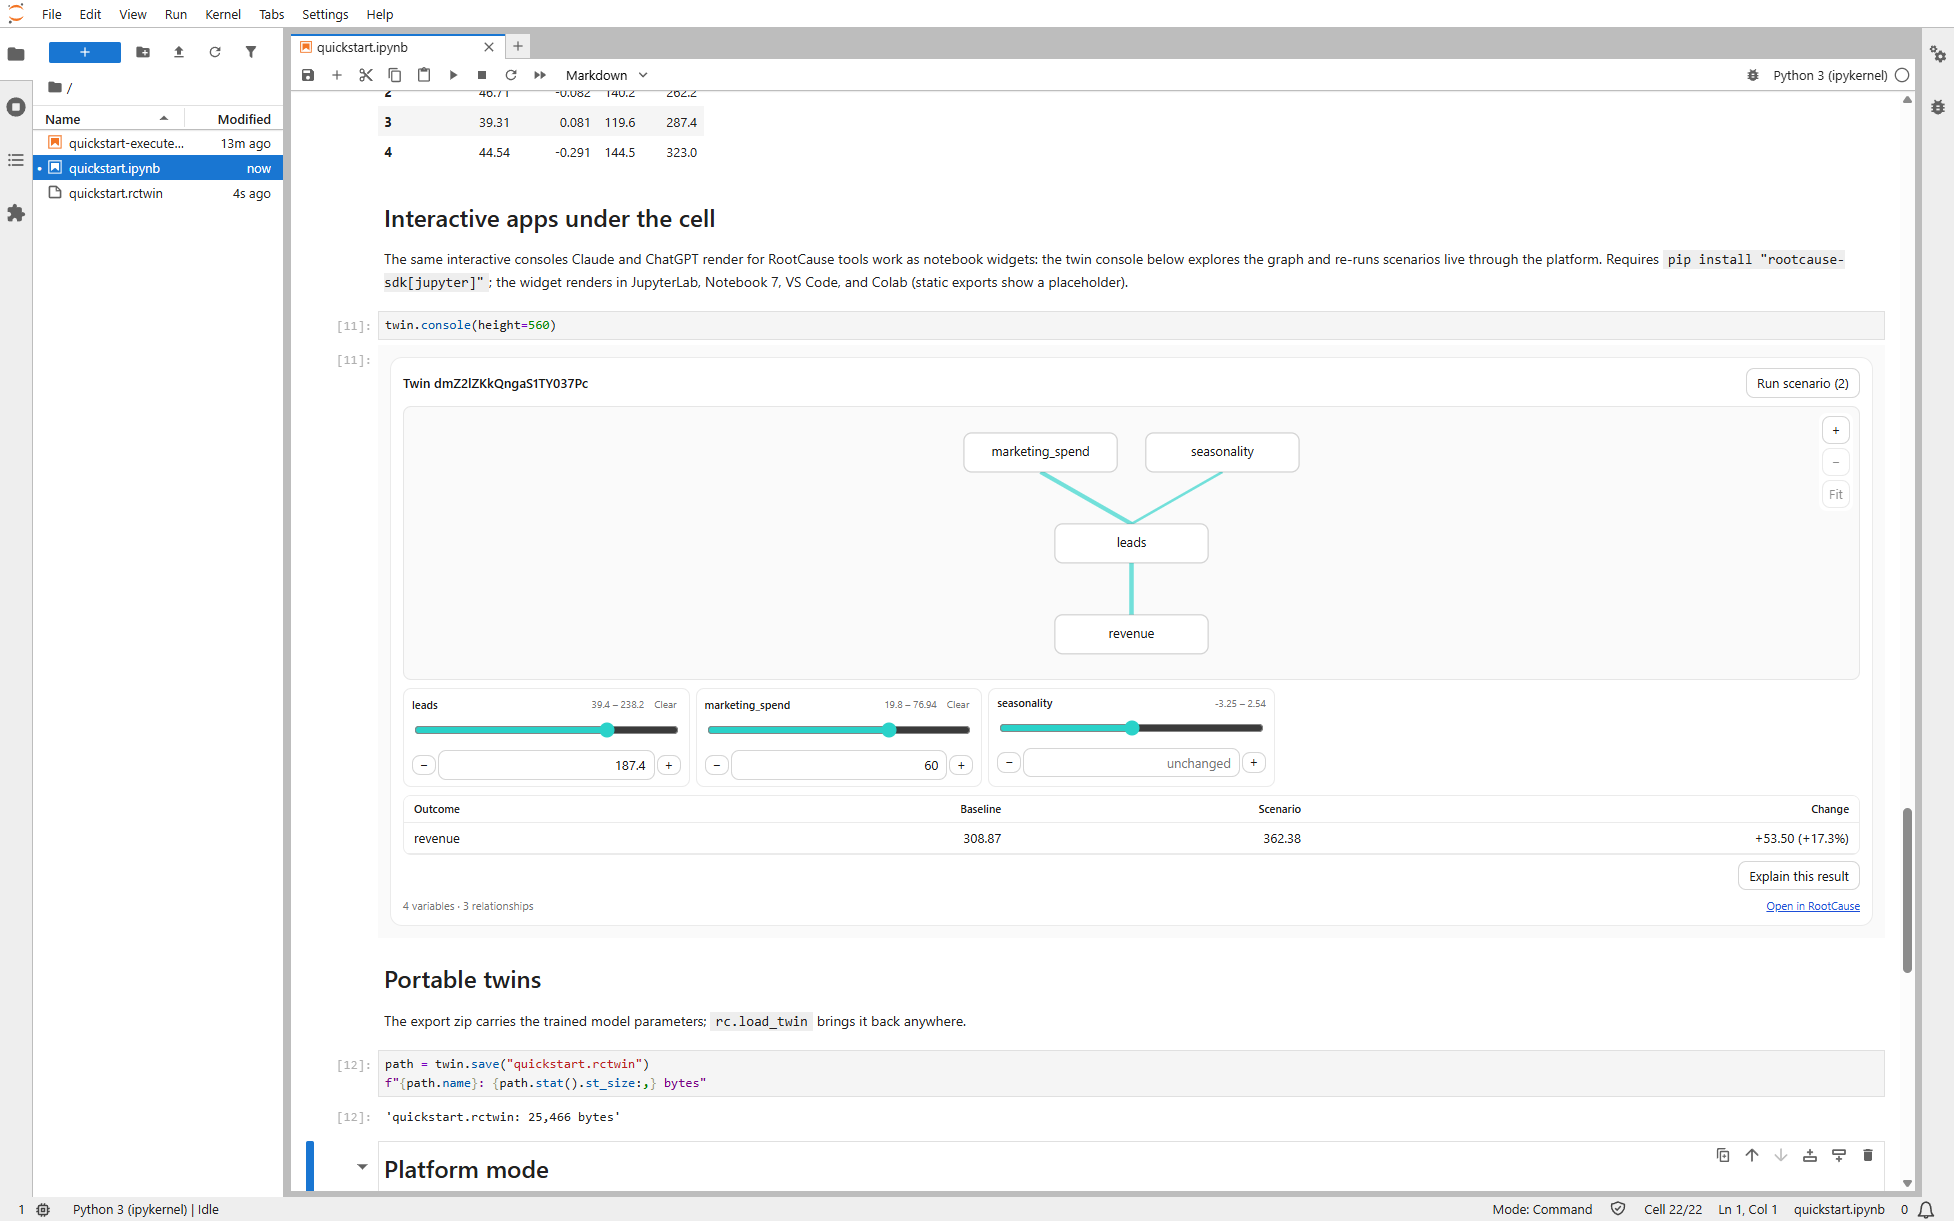
The causal-graph console appears under the cell: the DAG, edge strengths, intervention inputs, and a Run scenario button that executes against the platform and updates in place.

<figure><img src="https://1662811113-files.gitbook.io/~/files/v0/b/gitbook-x-prod.appspot.com/o/spaces%2FBXg3gZLR0e2Q8SzeQmql%2Fuploads%2Fgit-blob-56642d179a007fcf40342dbc2af2f505e8e8fd7c%2Fsdk-twin-console-scenario-jupyterlab.png?alt=media" alt="JupyterLab with the quickstart notebook open. Under a twin.console() cell, the interactive twin console shows the discovered causal graph (marketing_spend and seasonality into leads into revenue), intervention sliders with marketing_spend pinned to 60, and a results table reading revenue baseline 308.87, scenario 362.38, change +53.50 (+17.3%)"><figcaption><p>A scenario run inside JupyterLab: marketing_spend pinned to 60, revenue up 17.3 percent, computed live by the platform.</p></figcaption></figure>

Every control in that screenshot is live. The sliders pin interventions, Run scenario executes the simulation server side through the MCP gateway with your credentials, and the result lands back in the widget without the cell re-running.

Try it yourself with the quickstart notebook, which ends on this exact console:

{% file src="/files/b2D7TJZDzADhchoQ4IUR" %}
Download the quickstart notebook
{% endfile %}

## The causal-flow Sankey

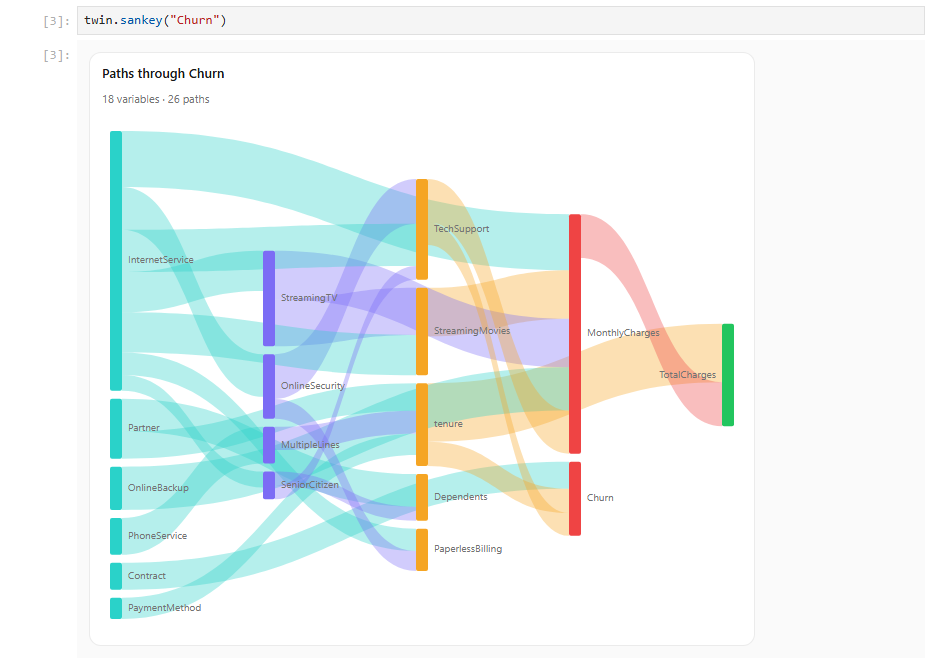
`twin.sankey` draws how causal influence propagates through the graph — everything flowing into and out of one variable, or the paths running through one specific edge:

```python
>>> twin.sankey("Churn")                            # paths around a variable
>>> twin.sankey(edge=("tenure", "Churn"), depth=3)  # paths through one edge
```

<figure><img src="https://1662811113-files.gitbook.io/~/files/v0/b/gitbook-x-prod.appspot.com/o/spaces%2FBXg3gZLR0e2Q8SzeQmql%2Fuploads%2Fgit-blob-2d1e0af802c20fb01dbed69ad094e26ba98d5f4d%2Fsdk-twin-sankey-churn.png?alt=media" alt="A twin.sankey(&#x22;Churn&#x22;) cell in JupyterLab. Under it, a Sankey diagram titled Paths through Churn (18 variables, 26 paths) shows causal influence flowing from InternetService, Partner, OnlineBackup, PhoneService, Contract and PaymentMethod through mediators like StreamingTV, OnlineSecurity, TechSupport and tenure into MonthlyCharges, TotalCharges and Churn, with ribbon width encoding path strength."><figcaption><p>Causal paths around Churn in a telco twin: ribbon width is path strength, columns are hops.</p></figcaption></figure>

Exactly one of `node` and `edge` is required; `depth` bounds how many hops the traversal walks on either side.

## The graph review console

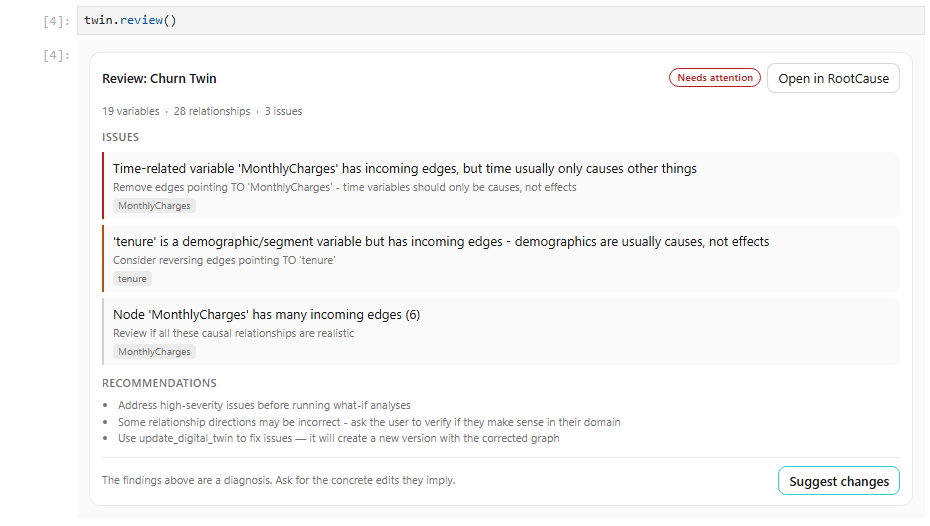
`twin.review` runs the platform's structural review of the causal graph — cycles, isolated nodes, weak or wrong-direction edges, over-connected hubs — and mounts the findings as an interactive console:

```python
>>> twin.review()
```

<figure><img src="https://1662811113-files.gitbook.io/~/files/v0/b/gitbook-x-prod.appspot.com/o/spaces%2FBXg3gZLR0e2Q8SzeQmql%2Fuploads%2Fgit-blob-1ea8ed2ea740ddc4c80ce4ba76ec6bf8c65ce8dc%2Fsdk-twin-review-churn.png?alt=media" alt="A twin.review() cell in JupyterLab. Under it, the review console for Churn Twin shows a Needs attention badge, 19 variables, 28 relationships, 3 issues: MonthlyCharges has incoming edges but time usually only causes other things; tenure is a demographic variable with incoming edges; MonthlyCharges has six incoming edges. Below, recommendations and a Suggest changes button."><figcaption><p>The review console: findings are a diagnosis, and Suggest changes turns them into concrete edits.</p></figcaption></figure>

## The What-If Studio

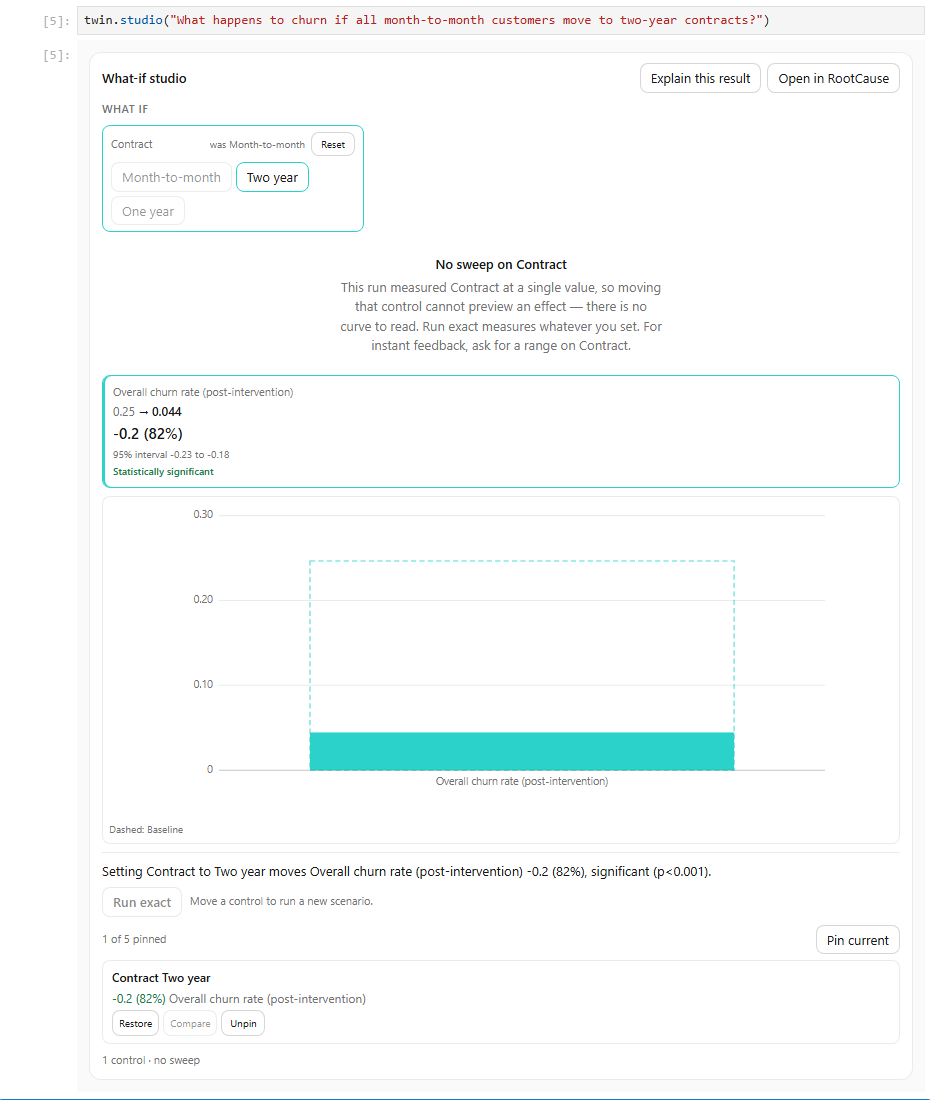
`twin.studio` takes a question in plain English, runs the scenario server side, and mounts the studio over the answer — with the dials behind the result, so moving a control re-runs a tweaked scenario without leaving the notebook:

```python
>>> twin.studio("What happens to churn if all month-to-month customers move to two-year contracts?")
```

<figure><img src="https://1662811113-files.gitbook.io/~/files/v0/b/gitbook-x-prod.appspot.com/o/spaces%2FBXg3gZLR0e2Q8SzeQmql%2Fuploads%2Fgit-blob-2feaf601153186a23f1231d23ca7dabb5213b853%2Fsdk-whatif-studio-churn.png?alt=media" alt="A twin.studio() cell asking what happens to churn if all month-to-month customers move to two-year contracts. Under it, the What-if studio shows a Contract control set to Two year, a headline result card reading overall churn rate 0.25 to 0.044, minus 0.2 (82 percent), statistically significant, a bar chart against the dashed baseline, a Run exact button, and a pinned scenario Contract Two year."><figcaption><p>One question, one instrument: churn drops 82 percent under the contract intervention, and the controls re-run live.</p></figcaption></figure>

Structured pins are available when inference should not decide: `targets=` for exact outcome variables, `horizon=` for forecast steps, and `environments=` / `aggregate=` on panel twins.

All four verbs together, on a twin of your own:

{% file src="/files/W12QiumqXQDqPo3RXpsF" %}
Download the notebook apps demo
{% endfile %}

## Any tool's app

The typed verbs cover the twin consoles. For everything else, `rootcause.jupyter.app` runs any MCP tool and mounts whichever app that tool declares:

```python
from rootcause.jupyter import app

app("get_source_preview", {"workspaceId": ws.id, "sourceId": source.id})
app("check_background_runs", {"workspaceId": ws.id})
```

A tool with no app of its own renders through the generic widgets app, which draws whatever widgets the result carries as cards and falls back to plain text when it carries none. The tool executes server side when the cell runs; the app receives the result and takes over from there.

## How it works

The app bundles are self-contained HTML documents that speak a small JSON-RPC protocol with their host. In a chat client, the host is Claude or ChatGPT. In a notebook, the SDK is the host: the bundle runs in a sandboxed iframe, and when it calls a tool (re-running a scenario, expanding a table), the SDK forwards the call to the platform's MCP gateway over HTTPS and returns the result to the iframe. Bundles are fetched from your platform deployment at render time, so they are always the version your server ships.

{% hint style="info" %}
Static notebook exports (nbconvert, GitHub rendering) show a placeholder where an app would mount, since the app needs a live kernel to answer its tool calls.
{% endhint %}